This is the first post in a two-part series highlighting challenges IT teams face in optimizing VMware performance. The original text of this series appeared in an article on Data Informed.
When virtual computing first became popular, it was primarily used for non-business critical applications in pre-production environments, while critical applications were kept on physical servers. However, IT has warmed up to virtualization, recognizing the many benefits (reduced cost, increased agility, etc.) and moving more business-critical and database applications into virtual environments. In a recent survey of 518 IT professionals we conducted, we found that 81 percent of respondents are now running their business-critical applications, including SQL Server, Oracle or SAP, in their VMware environments.
VMware Performance Becomes Critical as More Important Applications Virtualized
While there are numerous benefits, virtualized environments introduce a new set of challenges for IT professionals. For IT teams tasked with finding and resolving VMware performance issues, specifically those that can impact business-critical applications, many find they are hitting the same cumbersome roadblocks related to tools, time and strategy.
IT Pros Need Multiple Tools to Gain a Holistic View of their VMware Environments.
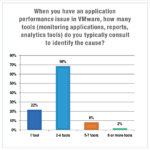
 According to the survey results, 78 percent of IT professionals are using multiple tools– including application monitoring, reporting and infrastructure analytics– to identify the cause
of VMware performance issues for important applications. Even further, ten percent of IT professionals are using more than seven tools to understand their VMs and the issues that affect VMware performance. Optimizing VMWare performance and availability is incredibly complex, and the dynamic nature of these environments require highly advanced tools to address even the most standard performance issues.
Relying on several reporting tools every time an issue arises just isn’t sustainable for most IT teams. This is partly due to the fact that solving application performance issues requires a view of multiple IT disciplines or “silos” such as application, network, storage and compute. In larger organizations, that means each time an issue arises, representatives from each discipline need to come together and compare their findings– and the analysis results from the application team’s tool may point to a somewhat different cause than the storage team or the network team’s tool. The current strategy of relying on multiple tools and teams to evaluate each silo leaves IT with the manual, trial and error task of finding all the relevant data, assembling it and analyzing it to figure out what went wrong and what changed to cause the problem.
Stay tuned for part two of this series, where we’ll discuss issues related to time and resources wasted in uncovering issues, as well as finding the root cause of VMware performance issues.
Read Roadblocks to Optimizing Application Performance VMware Environments – Part II