| February 14, 2021 |
About Using Amazon FSX for SQL Server Failover Cluster Instance |
||||||||||||||||
| February 6, 2021 |
SIOS Protection Suite for Linux Quick Service Protection
Using SIOS Protection Suite for Linux Quick Service Protection ResourceOn a recent engagement with the SIOS Professional Services team, a customer inquired about how to protect a custom application with the SIOS Protection Suite for Linux solution. One of the highly experienced high availability experts at SIOS Technology Corp., helped understand the customer’s application and laid out the methods SIOS provides for custom application support. SIOS Protection Suite for Linux provides multiple methods for adding high availability and application monitoring to custom applications. These options include the following:
Definitions Used in Chart Monitoring – defined as the ability to make a determination of the availability, accessibility and functioning of the protected application, database or service. A low level of application, database, or service monitoring provides basic coverage, such as a check for a running process, existence of a pid_file, or that the status command returns a ‘true’ result when executed. Note: A ‘true’ or ‘0 (zero)’ return code does not mean that the application, database, or service is running. But only that the command executed was able to successfully complete with a positive (‘true’ or ‘0 (zero)’) status result. The highest level of monitoring indicates that application specific knowledge is applied to determine the health and functioning of the application beyond lower level methods such as process status, ps output, or systemd status returns. The highest level of monitoring typically applies knowledge of recommended order of healthcheck operations, knowledge of dependencies, and analysis of the results obtained from status and monitoring commands. Recovery – defined as the ability to restart a failed application, database or service. A low level of recovery capability implies that commands for a restart are issued and expected output are obtained from the issuance of the command. The highest level of monitoring indicates that application-specific knowledge is applied to determine how to initiate an orderly restart of the application, database, or service, which may require knowledge of recommended order of operations, dependencies, rollbacks or other related remediation of a failed service. Solution: Quick Service Protection ResourceIn this engagement, the customer’s application had systemd compatibility. Based on their overall requirements for avoiding coding, minimal monitoring needs, and simple recovery procedures, we recommended the Quick Service Protection (QSP) Resource. The QSP resource works to quickly add support of a systemd service to the SIOS Protection Suite for Linux resource protection. In the case of Customer Example.com, they have a systemd compatible service, with the minimal required definition needed to start and stop their application. [Unit] Description=SIOS ‘as-is’ Example Service 2020 After=network.target [Service] Type=simple Restart=always RestartSec=3 User=root ExecStart=/example_app/bin/exampleapp start ExecStop=/example_app/bin/exampleapp stop [Install] WantedBy=multi-user.target Example.com systemd file SIOS recommends that prior to attempting the protection of the resource with the SIOS Protection Suite for Linux product, verify via systemctl that the example application stops and starts accordingly: # systemctl status example * example.service – SIOS ‘as-is’ Example Service 2020 Loaded: loaded (/usr/lib/systemd/system/example.service; disabled; vendor preset: disabled) Active: inactive (dead) # systemctl start example # systemctl status example * example.service – SIOS ‘as-is’ Example Service 2020 Loaded: loaded (/usr/lib/systemd/system/example.service; disabled; vendor preset: disabled) Active: active (running) since Fri 2020-08-21 14:53:27 EDT; 5s ago Main PID: 19937 (exampleapp) CGroup: /system.slice/example.service `-19937 /usr/bin/perl /example_app/bin/exampleapp start # systemctl stop example # systemctl status example * example.service – SIOS ‘as-is’ Example Service 2020 Loaded: loaded (/usr/lib/systemd/system/example.service; disabled; vendor preset: disabled) Active: inactive (dead)
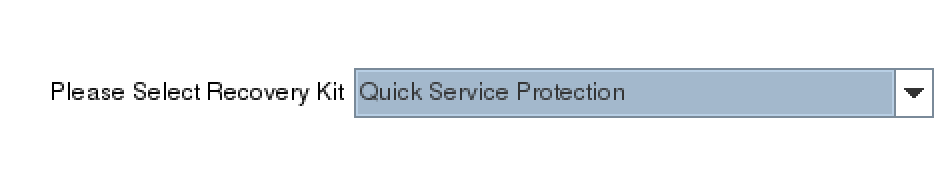
After verifying that the application functions correctly via systemd, restart the service and ensure that the service is running. # systemctl start example # systemctl status example * example.service – SIOS ‘as-is’ Example Service 2020 Loaded: loaded (/usr/lib/systemd/system/example.service; disabled; vendor preset: disabled) Active: active (running) since Fri 2020-08-21 15:59:44 EDT; 3min 2s ago Main PID: 30740 (exampleapp) Refer to the SIOS Protection Suite for Linux Quick Service Protection Suite documentation for additional details on the resource create process. Using the SPS-L UI select the Create option, indicated in the Global UI Resource Toolbar by the following icon: Once the create wizard is launched, select the Quick Service Protection option in the Create Resource Wizard Window
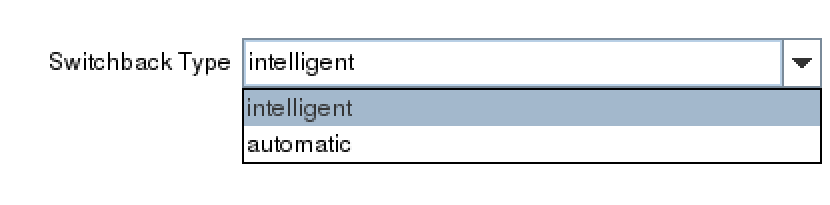
In the next prompt for ‘Switchback Type’, choose whether you will use intelligent switchback or automatic switchback.
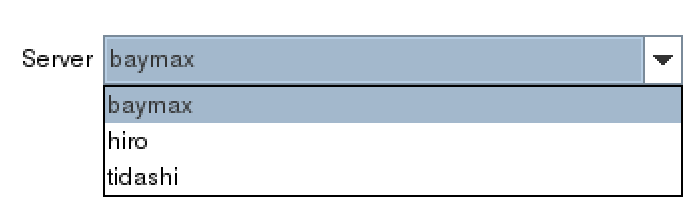
After selecting the ‘Switchback Type’, the Server dialogue appears allowing you to choose the primary server for the custom application.
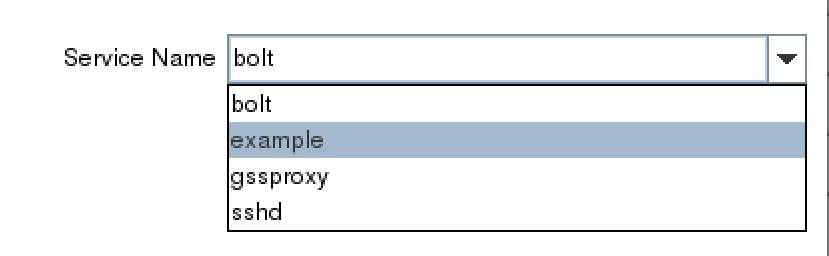
(Note: If the service requires storage, be sure to choose the same primary server previously selected for the storage resources.) In the Service Name dialog box, find the service for your custom application.
Once you’ve selected the correct service, example, determine whether you will enable monitoring or disable the monitoring service. Refer to the documentation to gain an understanding of the monitoring provided by the QSP resource.2
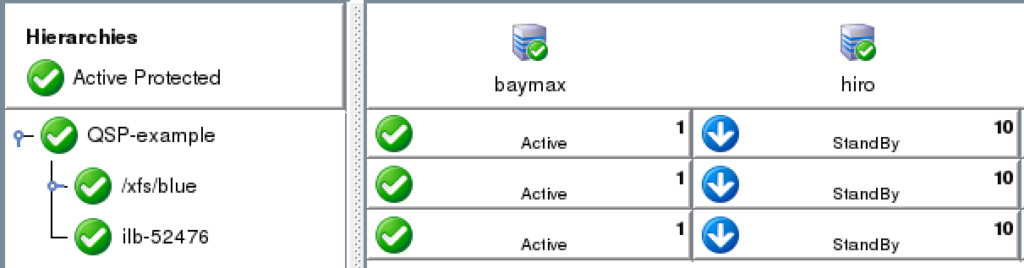
Next, choose a resource tag. A resource tag should be a meaningful name that will help your IT team quickly identify which SPS-L resource protects your application or service. Lastly, follow the final dialogue to complete the resource creation process. Once the resource is created, use the UI to extend the resource to additional servers. If necessary, create dependencies between the newly protected custom service/application and any other required resources such as storage or IP resources.
NOTES: 1 Creating a customer application recovery kit can be accomplished via an engagement with the SIOS Technology Corp. Professional Services Team. For more information contact professional-services@us.sios.com 2 The QSP Recovery Kit quickCheck can only perform simple health (using the “status” action of the service command). QSP doesn’t guarantee that the service is provided or the process is functioning. If complicated starting and/or stopping is necessary, or more robust health checking operations are necessary, using a Generic Application or Custom Application ARK is recommended Reproduced from SIOS |
||||||||||||||||
| January 29, 2021 |
How to Understand & Respond to Availability Alerts |
||||||||||||||||
| January 23, 2021 |
Do I Even Need High Availability software in the Cloud? |
||||||||||||||||
| January 16, 2021 |
Should I Still Use Zabbix In AWS?
Should I Still Use Zabbix In AWS?Amazon EC2 monitoringFor mission-critical applications, ERPs, and databases, such as SQL Server, SAP, HANA, and Oracle your application monitoring needs are best served by a clustering software like SIOS Protection Suite that monitors the full application stack (on-premises or in the cloud). If it detects an application issue, it orchestrates the failover of application operation to a standby node automatically. However, for applications that don’t require high availability clustering, Zabbix has a high market share as an integrated OSS monitoring tool. Although it has been widely used in on-premise environments, there are many examples of Zabbix being used in AWS environments. In spite of the fact that AWS also has monitoring services such as Amazon CloudWatch, why should you use Zabbix? This section explains the benefits of monitoring EC2 instances and other instances, as well as the configuration process. Why use Zabbix instead of Amazon CloudWatch?In an AWS environment, all of the infrastructure is operated by AWS, but you must be responsible for the operation of the Amazon EC2 instances themselves and the applications built on Amazon EC2. In other words, you must monitor the applications to ensure that they are operating properly, and you must take action when a problem occurs. For non-mission-critical applications, Zabbix is a good candidate for this kind of monitoring tool. Zabbix has the advantage of being able to monitor not only on-premises, but also cloud and virtual environments in an integrated manner. Whereas the standard Amazon CloudWatch is limited to monitoring AWS resources (CPU, memory, etc.), Zabbix allows you to monitor even the state of your applications in detail. The following is a list of other advantages of Zabbix. Integrated monitoring of environments with multiple AWS accountsAmazon CloudWatch performs monitoring on a per AWS account basis. Zabbix can monitor an environment of multiple AWS accounts, that can be monitoring business systems consisting of multiple accounts. It can also detect anomalies not only by simple alerts based on thresholds, but also by multiple thresholds and conditions in combination. It can be configured Detailed notifications to suit the actual conditions of operationAmazon CloudWatch can notify you with a message in the event of an anomaly. For example, if your system is down for maintenance, you don’t need to be notified by message. This is where Zabbix allows you to configure these cases in a way that allows you to suppress unwanted messages. This way you can ensure that you are only notified when something is really wrong that needs to be addressed. No retention period for metrics (monitoring log)With Amazon CloudWatch, metrics can be stored for up to 15 months. Moreover, you can only store metrics in hourly increments for 15 months, and if the monitoring interval is set to less than 60 seconds, you can only store them for a maximum of 3 hours. Zabbix allows for long-term storage of metrics without changing the granularity of information. How to monitor AWS environment with ZabbixIf you want to use Zabbix in an AWS, you will need to create an Amazon EC2 and DB instance and install Zabbix on it. After installation, the process of configuring Zabbix is basically the same as on-premise, except that you will need to set up the following
In addition, you can configure AWS-specific settings, such as creating a user in AWS IAM with the necessary permissions for Zabbix, which will allow Zabbix to monitor applications and other aspects of your AWS environment. Use the right tool for your monitoring needsNot all corporate systems operate in isolation, but many systems are linked together to exchange data and ensure consistency as a whole. In these environments, Zabbix is a great tool for monitoring and detecting anomalies across multiple servers and systems. For example, if a DB-based web application has an anomaly on the web application server, it is possible to disable the data, for example. On the other hand, Zabbix has a lot of configuration options, so you will have to decide what to monitor and how, and what conditions are abnormal. On the other hand, Zabbix has a lot of settings, so you have to design the operation exactly what to monitor and what to do about it, and what to do about it. Of course, for critical systems such a design is essential, however, for relatively simple systems, such as “if a process stops, just restart it”, there is no match for Zabbix monitoring. For mission-critical applications, SIOS Protection Suite includes application recovery kits that provide application-specific monitoring of the entire application environment, server, storage and network as well as failover orchestration according to application-specific best practices on Amazon EC2. Don’t trust your application availability and monitoring to just anyone. Get in touch with the availability experts at SIOS to see how we can help you. Reproduced from SIOS |