Date: December 11, 2020
Tags: Datadog, SIOS Appkeeper
Using Datadog for Amazon EC2 Monitoring? Pair with SIOS AppKeeper for Automated Remediation
Have you ever thought to yourself, “It would be nice if Datadog could monitor our Amazon EC2 services and automatically restart them when it detects a failure?” I thought the same thing, and decided to try it out for myself.
SIOS AppKeeper automatically monitors Amazon EC2 instances for failures and automatically restarts instances or even reboots services when failures are detected. I thought to myself, “What if we combined the monitoring capabilities of Datadog with AppKeeper’s automated remediation capabilities?”
It worked, and here is how I did it.
If you are already using Datadog and are interested in trying this out for yourself, please sign up at the end of this article for access to our API.
Here are the steps I took to set up AppKeeper to receive alerts from Datadog and restart the webserver on Amazon EC2 when downtime is detected.
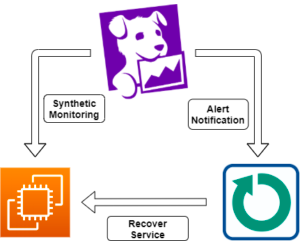
To run this experiment successfully, we already had a Datadog account, an AppKeeper account and a NGINX webserver running on Amazon EC2 (using Linux 2).
How to integrate Datadog with AppKeeper to provide automated remediation
Step One: Get the Restart API Token from AppKeeper
Request the API Token for the Datadog integration from this form:
https://mk.sios.jp/BC_AppKeeper_Datadog_api_application
If you request it from the form, the token will be sent to the email address you provide.
Step Two: Create the tenant in AppKeeper
The next step was to register the AWS account to which the monitored instance belongs in AppKeeper. (AppKeeper refers to the registered AWS accounts as “tenants.”)
Step Three: Create IAM Role in AWS
I then created an IAM Role in AWS (you need this to set up your AppKeeper account). Here are instructions if you are unfamiliar with this process.
Step Four: Add the tenant in AppKeeper
The next step was to add the “tenant” in AppKeeper (AppKeeper considers an AWS account a “tenant”). Here is a link to detailed instructions on doing this.
Step Five: Set up the Synthetics Test in Datadog
I then needed to configure Datadog’s outline monitoring for the Nginx server (EC2 instance) that we want to monitor. Here’s how to do that:
Open the Datadog dashboard and select UX Monitoring > Synthetic Tests from the menu.
Click the [New Test] button in the upper right corner and select [New API Test] to create an outline monitoring case.
Enter the following information in the form to create an outline monitoring case.
- Choose Request Type
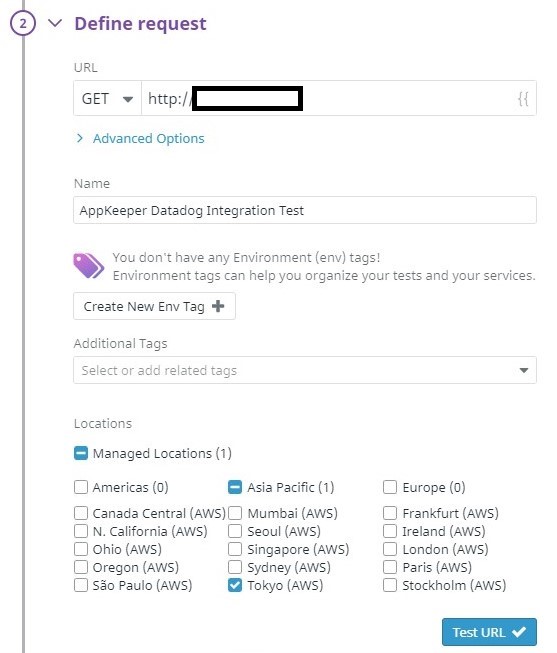
Select “HTTP”. - Define Request:
Set the following values.
URL : GET http://{{{ EC2 IP address }}
Name : AppKeeper Datadog Integration Test (any name)
Locations : Tokyo
3. Specify test frequency
No Change
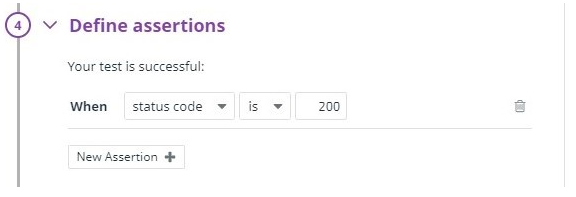
4. Define assertion
Click on “New Assertion” and set the following values
When : [status code] [is] [200]
5. Define Alert Condition
No Change
6. Notify Your Team
No Change
Step Six: Run the Synthetics test in Datadog
Once the above inputs are completed, press “Create Test” to create the test case for external monitoring.
The results are visible and we can see that the webserver is working properly in the “Test Results” section.

That was all that had to be done to configure Synthetics monitoring using Datadog.
Step Seven: Set AppKeeper to receive Synthetics alerts
Next I had to set AppKeeper as the notification destination. From the Datadog menu, go to Integrations and select the Integrations tab.
In the search box, enter “Webhooks” to find the Webhooks integration.
Click “Available” to enable the Webhooks integration in your Datadog account. (Once enabled, it will appear in the “Installed” column.)
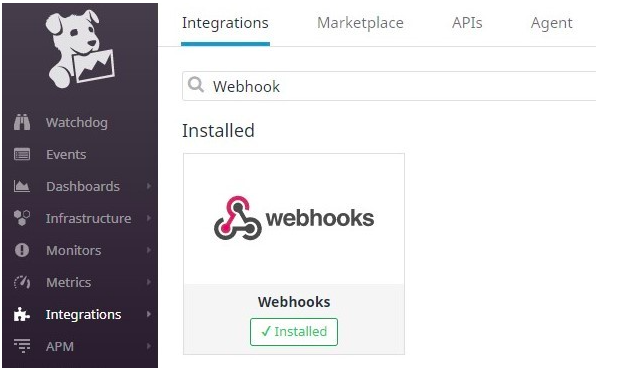
Click on “Configure” to open the Webhooks integration configuration page.
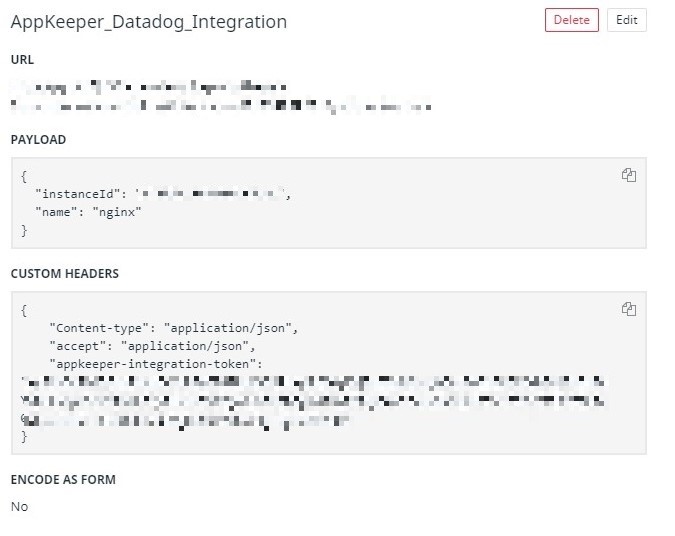
In the “Webhooks” column at the bottom of the page, click “New +” to create a new Webhooks notification destination. For the parameters, enter the following
Name : The name of the integration (any name)
URL : https://api.appkeeper.sios.com/v2/integration/{{ AWS account ID }}/actions/recover
Payload :
| {
“instanceId”: “{{ EC2 Instance ID}}”, “name”: “nginx” } |
Custom Headers: Check the box and enter the following
| { “Content-type”: “application/json”, “accept”: “application/json”, “appkeeper-integration-token”: “{{ Get AppKeeper external integration tokens The tokens obtained in }}” } |
When you are done, press “Save.”
Step Eight: Connecting AppKeeper to the Synthetics test
Next, I had to configure AppKeeper (the registered Webhooks integration) to be called when an alert of the Synthetics monitoring occurs.
Open the test case that you set up in “Configuring the Synthetic Monitoring with Datadog” from UX Monitoring > Synthetic Tests in the menu.
Select “Edit test details” from the top-right gearbox and enter the following values in the “5. Notify Your Team” box to save the changes.
| @webhook-{{ Name of Webhook integration in Datadog }} |
※ You can set “renotify if the monitor has not been resolved”. You can retry if AppKeeper fails to recover for the first time. It is not required for testing purposes, but we recommend you to set it to [10 minutes] (minimum interval).
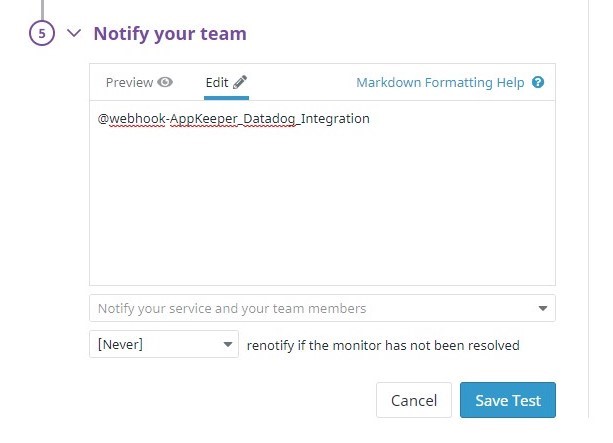
Setup is now complete.
Step Nine: Confirm the integration by running the test again
I then confirmed that AppKeeper would restore the webserver if Datadog detected it to be down.
Open the Synthetics monitoring test case you just set up from UX Monitoring > Synthetic Tests in Datadog.
Click “Resume Test” in the upper right corner and turn on the Synthetics monitoring.

Now Datadog will perform Synthetics monitoring at regular intervals.
The Test Results show that the server is successfully accessed.
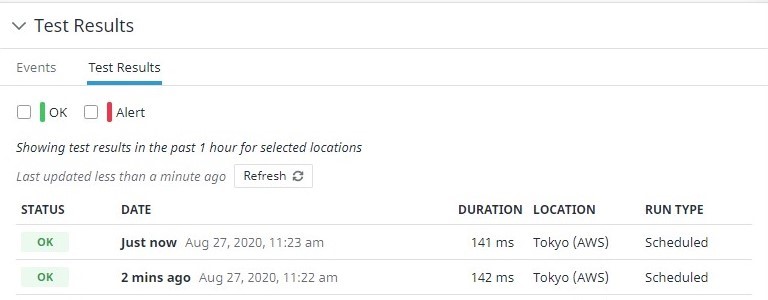
Next, I created a pseudo-failure of the web server to test AppKeeper’s automated remediation.
Since it is difficult to cause a real failure, I stopped the service and created a situation in which you cannot view the web page. To do this I connected to the EC2 instance where the Nginx server is installed using SSH and stopped Nginx.
| sudo systemctl stop nginx |
After a short wait, Datadog detected that the web server is no longer accessible.
The Synthetic Tests page in Datadog also shows that the test case has failed.
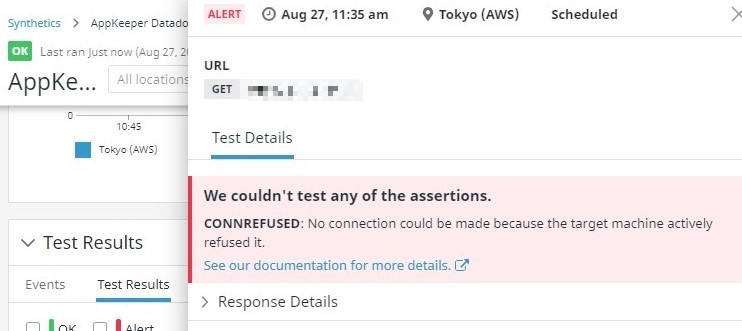
If the test case fails, Datadog will notify AppKeeper that the Synthetics monitoring has failed.
When AppKeeper receives the notification, it will automatically attempt to restart Nginx.
So, if you wait a little while, you see that Datadog’s Synthetics monitoring check will pass again.
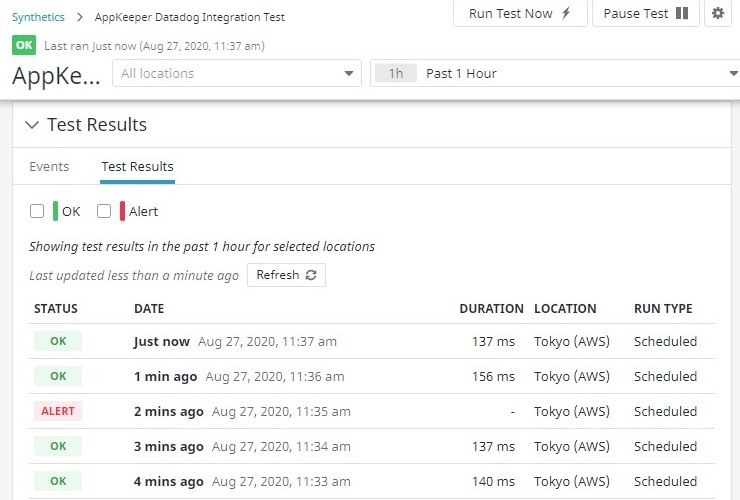
Also, if you log in to your AppKeeper dashboard, you’ll see that the recovery has been performed.

—
In this exercise I used a web server (Nginx) as an example to automate the process of detecting a failure with Datadog and restoring the service with AppKeeper.
Similar automation could be achieved by integrating Datadog with EventBridge and Lambda or by creating custom scripts.
However, if you frequently add target instances or restart a wide variety of services, the cost and complexity of maintaining EventBridge and Lambda or scripts will increase.
AppKeeper’s proven integration with Datadog and the ease with which you can add target instances to your application makes it easy to add automation to your DevOps environment to reduce your downtime.
If you are currently using Datadog and would like to try out AppKeeper’s Restart API, please first sign up for our 14-day free trial here (you can purchase a subscription once you have installed the free trial). Then click here to request a free trial. We’ll walk you through the process and provide you with a free evaluation token to help you get started.
Thank you. I hope you will take this opportunity to learn more about SIOS AppKeeper, which provides automatic monitoring and recovery of applications running on EC2.
— Tatsuya Hirao on the SIOS Technology technical team.
Reproduced with permission from SIOS
